DETAILED COMPONENT PERFORMANCE
Compressor and Diffuser
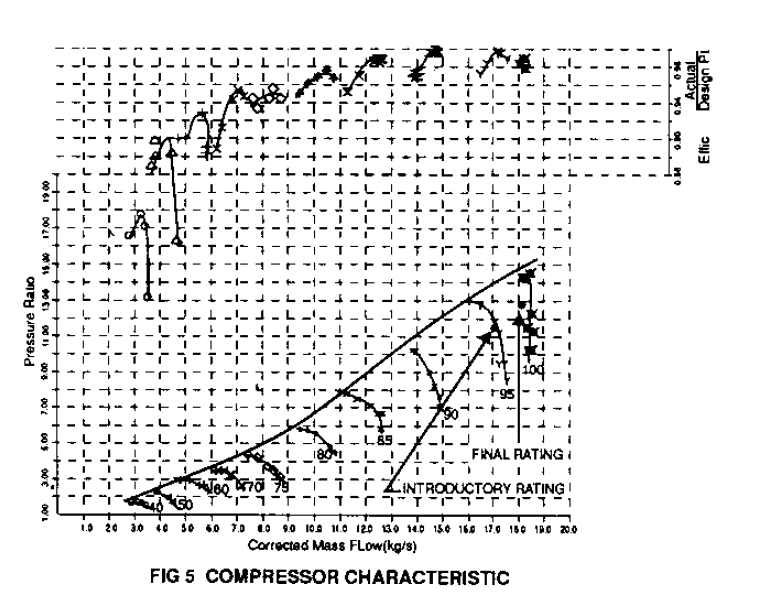
The performance of the engine compressor,
following the clearance adjustments, was found
to be very close to the rig measured results.
The basic parameters of engine measured mass
flow, efficiency and pressure ratio are
superimposed on the rig measured results in
Figure 5.
The reason for the starting ease is
apparent from Figure 5 where the surge line is
noted to be almost straight, therefore
offering a constant surge margin with speed.
Compressor blade vibration characteristics
have been measured over a wide operating speed
range. Figure 6 shows the predicted Campbell
diagram for the first stage rotor blade with
the ratio of maximum measured dynamic strains
relative to the allowable super-imposed.
The compressor exit diffuser is also
observed to be performing close to design with
a recovery of .68 being achieved relative to
the expected level of .65. Figure 7 shows the
predicted pressure recovery along the diffuser
using STAR CD prediction code.
Turbine Cooling
Cooling validation on the turbine is
carried out on both engine and rigs, the
methods are well described in Reference 3 Figure 8 shows the installation of 0.25 mm
diameter thermocouples on the HP stator
blades. These thermocouples are used to
measure blade temperature and in conjunction
with gas temperature measurements via fixed
rakes the cooling effectiveness of the blading
is established. Figure 9 shows the measure-
ment of cooling effectiveness of the blade
relative to design predictions. The
results confirm the blade to be well cooled
with the leading and trailing edges being
close to prediction while the bulk of the
blade is slightly overcooled.
Similarly, measurements for the HP rotor
blade using infra-red optical pyrometry
measurement techniques confirmed that metal
temperatures were below 800°C as required to
achieve the required 40,000 hours creep rupture
life.
Turbine Blade Vibration
The two turbine rotor blades have been
subjected to an extensive design-validation
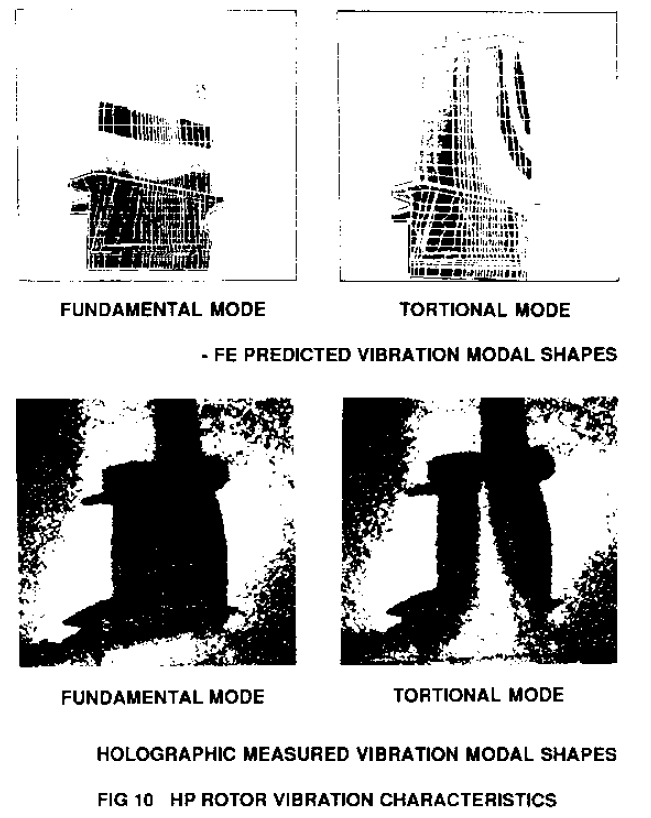
route to ensure their integrity. A full 3D
Finite Element model of the blades, including
cooling geometry, has been generated allowing
stress and vibration characteristics to be
established. Figure 10 compares the finite
element predicted vibration displacement modes
with the laser holographic measurements. To
establish the actual dynamic stress level,
however, engine strain gauge measurements are
essential where the effects of forcing,
damping and temperature are realised.
As with the compressor, radio telemetry, as
shown in Figure 11, is used to transmit the
signals from the rotor. Having overhung
turbine wheels allows simple access for wiring
from both discs and blades. Cooling of the
telemeter is essential, however, and
temperatures in the telemeter housing are
maintained below 100°C to protect the
electronic transmitters and batteries.
Figure 12 shows a typical spectrum
analysis of the HP rotor blade. The clarity
of the signal is evident from the trace. To
ensure all conditions are fully simulated the
engine was run at various loads and speeds and
transient operations including load shedding
and accepting. From the results the Campbell
diagrams can be produced as shown in Figure
13. To establish the maximum strains the FE
vibration model is used to relate the strain
gauge measurements to other areas of the blade
The interesting aspects of the HP rotor
blade are that the first natural frequency is
relatively high at 2625 Hz, therefore,
avoiding any low engine orders. Stator blade
interferences 40x and 52x, HP and LP res-
pectively, occur below running speed on the
4th and 6th modes. The stress levels, even
for these modes, are relatively low and do not
cause concern.
Rotor Dynamics
The dynamic performance of the gas turbine
rotor has been shown to be extremely robust
and stable with levels of vibrations well
within the required API levels. The rotor
bearing system has also been shown to be
relatively insensitive to bearing clearances.
Tests using a wide range of clearances on both
bearings gave an unchanged result in terms of
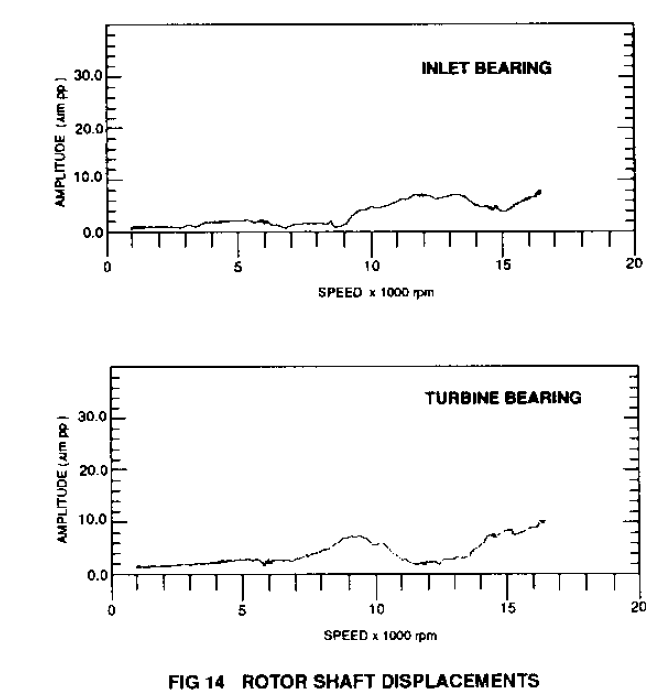
synchronous and subsynchronous levels. The
rotor operates between the second rigid body
mode and the first bending lateral. Figure 14
shows the unfiltered vibration amplitudes
results over the full speed range.
Combustion and Emissions
The development engines have been tested
on both natural gas and fuel oil over their
entire load range. Traverse measurements and
metal temperatures of the combustors and
transition ducts were taken at several points
in the load range. Figure 15 shows the
traverse at entry to the nozzle guide vanes.
Emission measurements of NOx and CO have also
been taken at several load conditions. With
water or steam injection the levels of No can
be significantly reduced as shown by Figure
16. Levels of CO rise with increased water
injection rates and an optimum water fuel
ratio is found to be around 0.7:1.
Package and System Tests
The Typhoon has also been tested, on a
development basis, against a generator, as
shown in Figure 17, to allow the control
zw system to be finely tuned. The test facility
has the ability to apply or reject the full 4
MW block load thereby allowing the response of
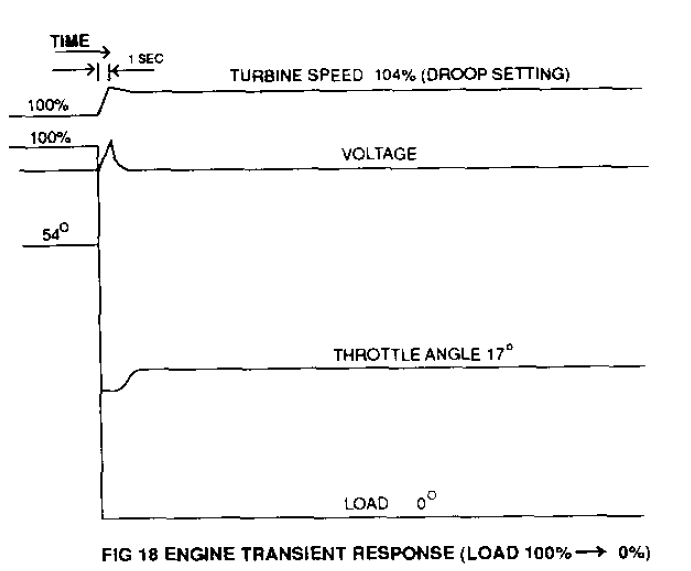
wxcv the engine to be established. Figure 18 shows
a typical recovery following a full load
rejection. The speed change is noted to be
within the 4% droop of the governor and the
recovery within one second interval.
Other features tested during the package
development are the systems including lub oil,
fuel, starting, fire and gas and acoustic
COMBUSTERS
enclosure.
Cyclic Endurance
Having established that the engine per-
forms to specification the ultimate test is
to simulate field operation via an accelerated
cyclic programme. The severity of the cyclic
programmes are devised to reduce the test
time. In this particular case the number of
transients which the engine has been subjected
to is considered to be equivalent to 40,000
hours field operation for a typical
installation.To provide information
stability and other major
simple cycle, as shown in
applied. This cycle entails
speed with a rapid application
The engine is then allowed
minutes at full temperature
down and being spun at relatively
quench the engine.The cycle shown in Figure 19b has been
devised, principally, to thermally cycle the
hot end of the engine including combustor,
turbine blading and stator support systems.
This cycle commences in a similar manner to
the first with a start to full speed and a
rapid load application. Following the initial
warm up half load changes are carried out to
simulate large electric motors being brought
on line.
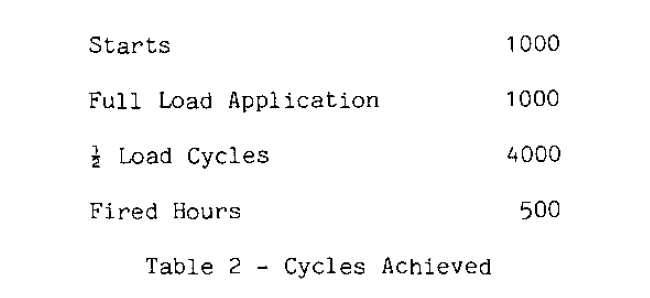
These two cyclic programmes were carried
out on core 3 over a four month period with
the final tally as shown in Table 2.
The stripdown of the engine following the
endurance programme revealed the engine to be
in excellent condition. Figure 20 shows some
of the components following the stripdown.
The only area to show some distress was a
honeycomb tip rim seal which had sections of
fatigued honeycomb due to the proximity of the
seal track relative to the edge. In this case
the solution was to re-position the seal
slightly downstream.
Following the endurance programme the
engine has been rebuilt with all the original
parts including the honeycomb seal and was
subsequently used for the package tests.


Hi, do you kow what is the maximum contious speed for the Power turbine of ruston tb5000?
ReplyDelete